If you need to run Grafana on the Guix System this post is the right place. In this example we'll setup Grafana to read metrics from the same machine it's run upon, but you can adapt this to use a remote datasource.
First of all, add gocix to your Guix channels and run guix pull.
After making sure you have gocix in your guix describe output, you just need to add the following services to your operating-system record and reconfigure your system.
(use-modules (oci services grafana)
             (oci services prometheus)
             (gnu services monitoring))

(operating-system
  [...]
  (services
    (list
      [...]
      ;; Prometheus node exporter
      (service prometheus-node-exporter-service-type)
      ;; Prometheus OCI backed Shepherd service
      (service oci-prometheus-service-type
               (oci-prometheus-configuration
                (network "host")))
      ;; Grafana OCI backed Shepherd service
      (service oci-grafana-service-type
               (oci-grafana-configuration
                (network "host"))))))
After you can see both Prometheus and Grafana spawned as Docker containers, such as in this example
docker ps
CONTAINER ID   IMAGE                     COMMAND                  CREATED          STATUS          PORTS                                                                                  NAMES
fede69fcf4bf   prom/prometheus:v2.45.0   "/bin/prometheus --w…"   26 seconds ago   Up 25 seconds   0.0.0.0:9000->9000/tcp, :::9000->9000/tcp, 0.0.0.0:9090->9090/tcp, :::9090->9090/tcp   docker-prometheus
caa2dc1f50c0   bitnami/grafana:10.1.5    "/opt/bitnami/script…"   26 seconds ago   Up 25 seconds   0.0.0.0:3000->3000/tcp, :::3000->3000/tcp                                              docker-grafana
you should be able to visit localhost:3000 and see the Grafana login page.
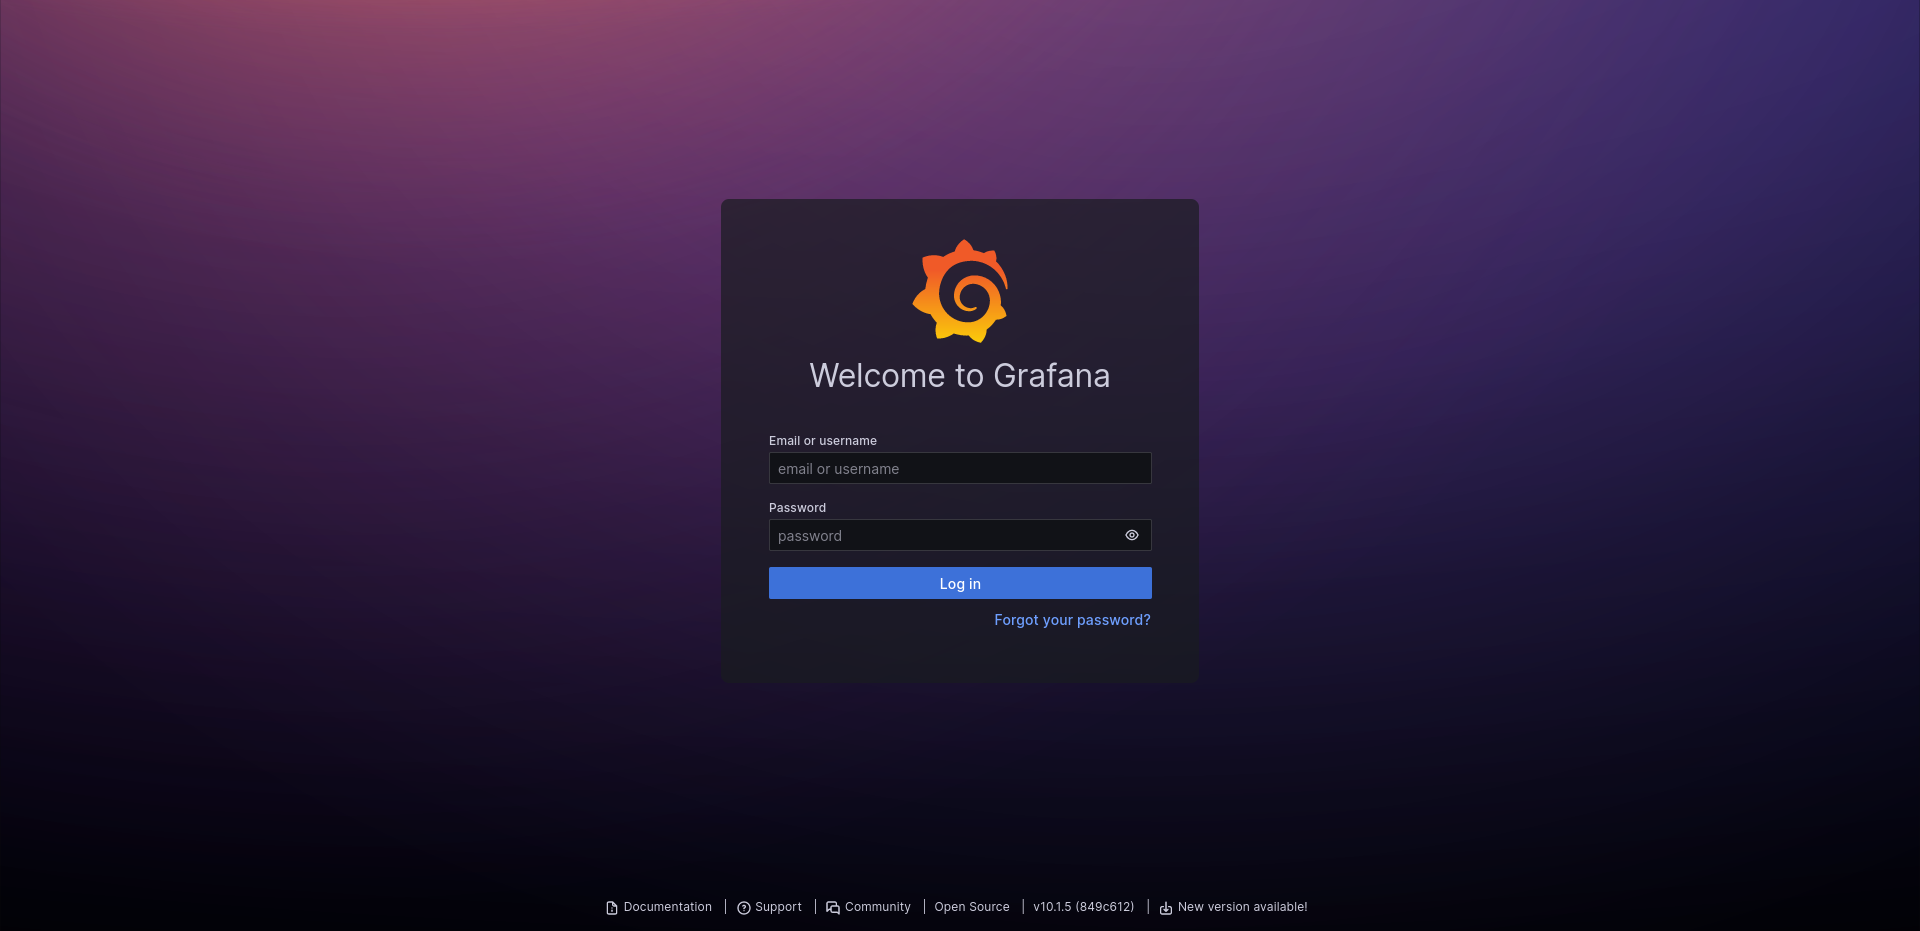
The default credentials are admin:admin, log in and configure a new datasource with http://localhost:9090 as URL. In this example we'll avoid creating a new dashboard from scratch and we'll import one from the Grafana's website. Just click on the button to create a new dashboard and choose the import option, paste 1860 as the Dashboard ID, select the Prometheus datasource you just created and import the dashboard.
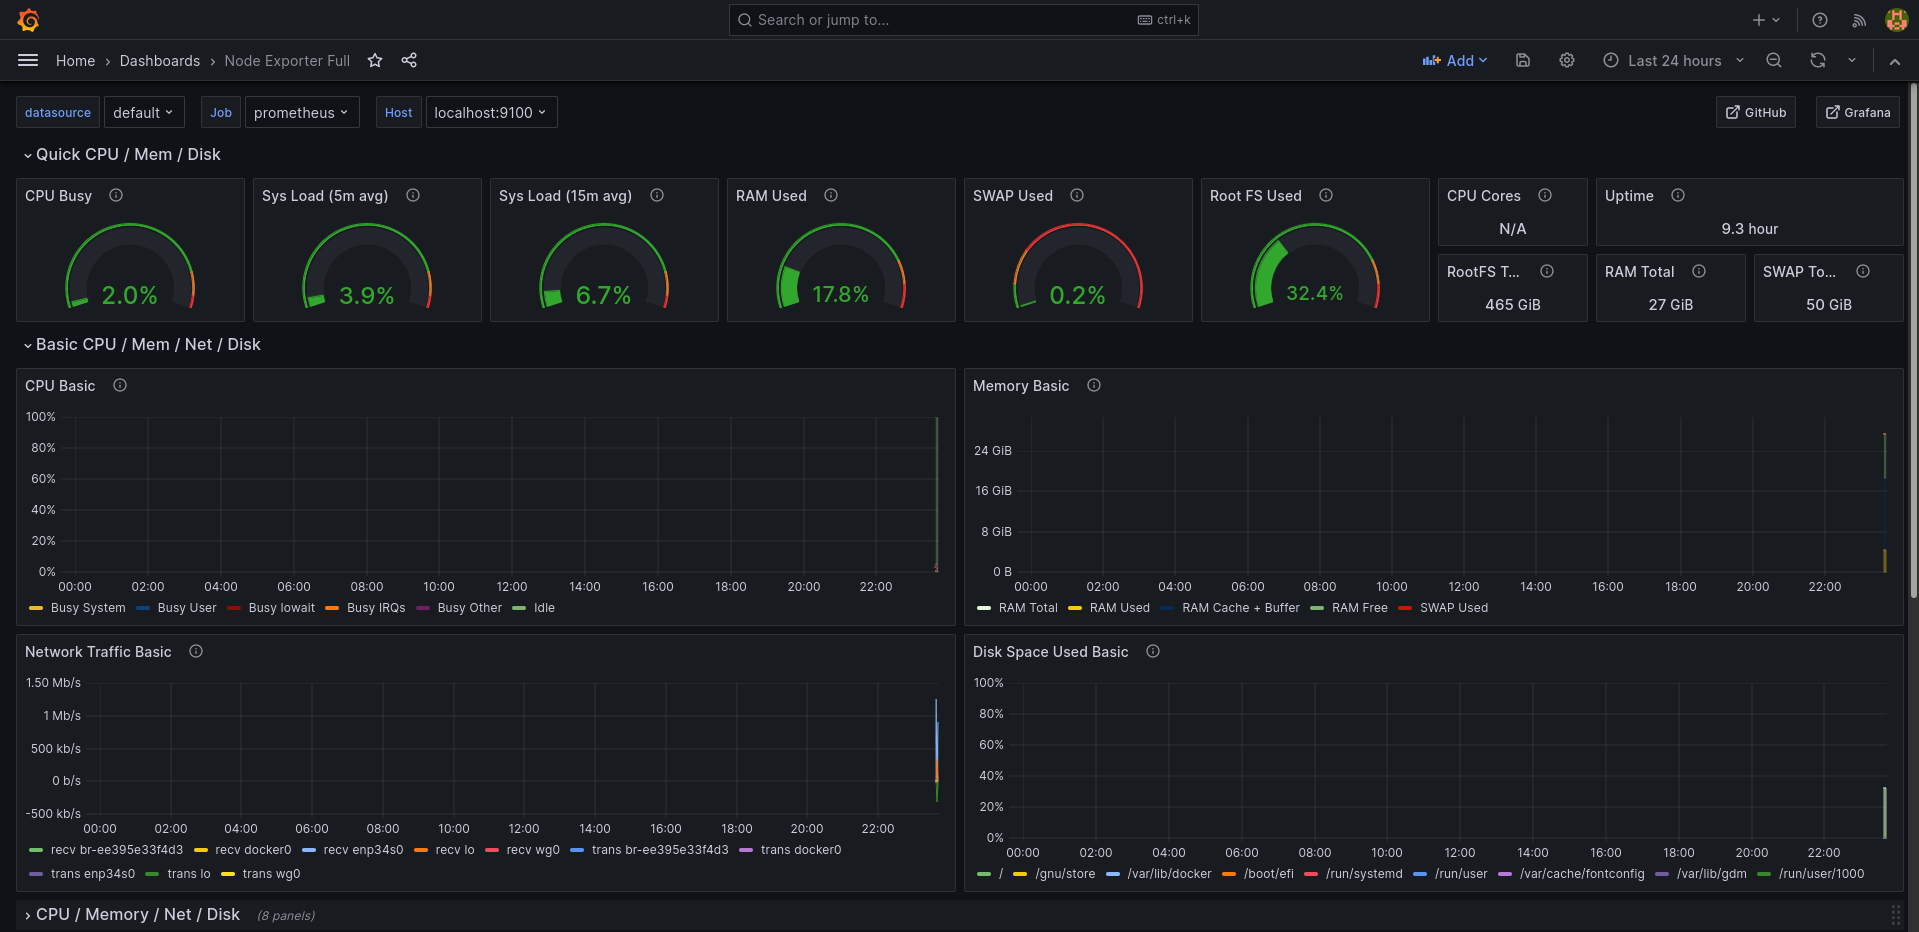
You should be presented with the full data available from the prometheus-node-exporter-service-type by default.